

|
Energie ontwikkeling |
|
|
|
 |
|
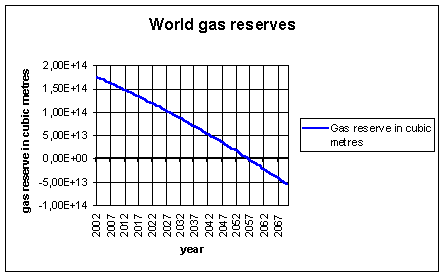
Gas The gas calculations were done the same way as for the oil. Gas reserves will run out in the year 2057. |
 |
|
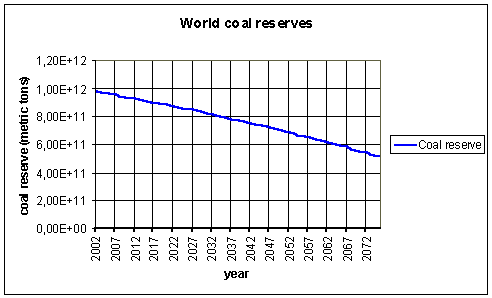
Coal The coal calculations were done the same way as for the oil. Coal reserves will not run out before the year 2072, the population increase predictions after 2072 are too uncertain to base forecast upon. |
 |
|
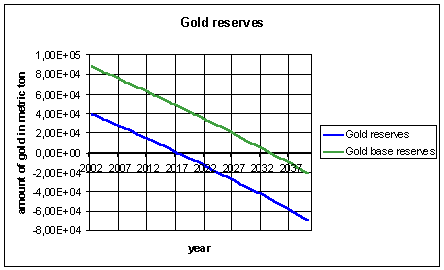
Gold The world gold reserves are shown in figure 4. Two lines can be seen, one based on reserves and one based on reserve bases. The first line predicts the gold reserves will run out in the year 2018, the second line predicts the gold reserves run out in 2034. |
 |
|
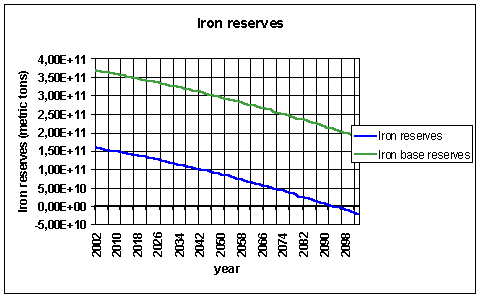
Iron The iron calculations were done the same way as for the gold. Iron reserves will run out around the year 2098. The iron base reserve will not run out for quite a time. |
 |
|
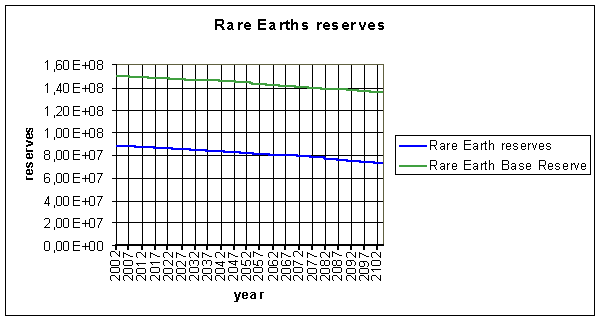
Rare Earths The rare earths calculations were done the same way as for the gold. Rare Earths reserves will not run out for quite some time. |
 |
|
The world's energy from fossil fuels |
 |
|
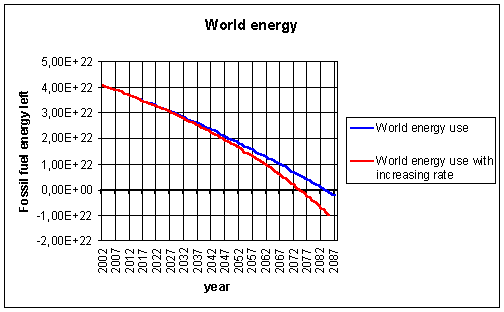
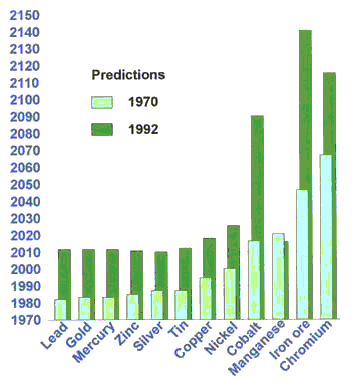
This graph (figure 7) shows the energy from fossil fuels (oil, gas and coal) present over the years. As the fossil fuel reserves decrease over the years, the energy provided by these fossil fuels also decreases. The blue line shows the energy from fossil fuels assuming the energy consumption per person is constant and taking into account the calculated population growth. In this case there will be no more energy from fossil fuels after 2083. The red line shows the energy from fossil fuels taking into account an increase in consumption rate per person, going towards an American lifestyle. The consumption rate for Americans was kept constant and the consumption rate of the rest of the world increased by 2 % per year. In this case the fossil fuels are finished in the year 2074. Predictions are always hard and often readjusted. This graph (figure 8) shows the predictions when certain materials would run out of 1970 and again of 1992: |
 |
|
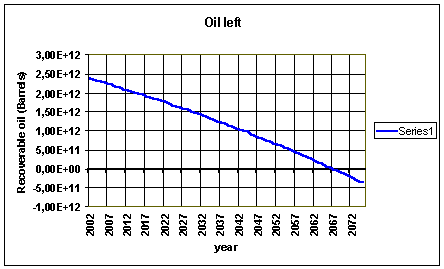
DISCUSSION As is stated in the introduction, there are some reasons that might indicate that predictions concerning population growth for non western European countries (other than northern America) are not that accurate. However we believe that this has the following effects. Since economic growth is not that rapidly in (for example Africa) the mortality rate will not drop as quickly as the birth rate does. However since the thirs worlds is experiencing the change much more rapidly, lifestyles (which includes the number of children normal to have) will not change easy with them which would lead to a relative birth rate increase compared to Europe in the same period. The other two differences stated in the introduction are a little more difficult to interpret. They both have a negative effect on economic growth because this growth has to be divided over a greater number of people since nobody is able to move away (at least not in great quantities) and there were a lot more people to start with. Therefore it is difficult to say whether the predictions upon population growth are accurate. And since this is the best model we have we should use this. Because population growth might not be described completely accurate it is at least a good approximation. As can be seen in the results (figure 4 and 8), the year in which we will run out of gold has been adjusted quite a bit. In 1970 it was 1980, in 1992 it was 2010 and our prediction is 2018 (considering reserves) and 2034 (considering reserve bases). The same counts for iron which was adjusted from 2045 in 1970 to 2140 in 1992 to a much higher year not really predictable with our calculations (when reserve base is considered). Trends like this can have many reasons. Older calculations could be to inaccurate, huge amounts of new material could have been found in the mean time, production rates could have decreased tremendously in the mean time or other mining techniques could have become economically available (so they could be used with costs lower than the profits) which doesn't necessarily mean that the techniques have become cheaper but could also imply that profits have raised. Finally new mining techniques could have been developed. Probably the difference in the predictions is caused by the latter two. It is not reasonable that the calculations where to inaccurate not is it reasonable that huge amount of every material has been found in the mean time. Almost all production rates will have risen since 1970 due to the increasing economic growth in countries like China, India and other southern Asian countries. So very likely some mining techniques will have became cheaper absolutely, some mining techniques became cheaper relatively (due to increasing of the value of the materials on the market) and some new mining techniques have become available. This would have as affect that some parts of the resources become part of the reserve base and some parts of the reserve bases would become part of the reserves which therefore would result in an increase of both the reserve and the reserve base and so increasing the predictions of both. What is stated in the above does not mean that predictions on reserve lifetimes are not useful. Predictions are necessarily if only to remind us that our reserves are finite. It at least tells us that we might not no when it will run out, it will run out and we must start to look for other materials we can use instead. Furthermore predictions on reserve lifetimes are useful to give us a rough indication of the year we will ran out. In our calculations gold reserves are depleted in 2018 and gold reserves bases are depleted in 2034. These predictions might vary but it is very likely that young generations will witness the day we do ran out. Therefore it is useful because young generations must think how to fill the gap that gold will leave when we do ran out. In the case of oil, gas and coal, which to our calculations will be depleted in respectively 2068, 2057 and coal will probably run out somewhere in the 22th century, we must realize we might run out in our lifetimes but we will almost certainly run out in the lifetimes of our children and grandchildren. And because new techniques of producing energy take a lot of time developing we should start searching for alternatives right now. The most important factor in predicting lifetime reserves are the initial reserves of the material. So it is of uttermost importance to keep the reserves as accurate as possible. All materials that are mined are mined against lower costs than there profits. If we can reduce the costs of mining by for example reducing the inaccuracy of finding the materials (like oil) so that when a company starts to drill the chance that they will in fact find minable oil increases. If the market value of materials drops, certain parts of the reserves will shift to reserves base which leads to a smaller reserve. Also when a material becomes cheaper, in some cases the production might increase. All mining operations of every material have an effect on the environment. Before people start mining at certain places we have to decide whether it is worth the impact it will have on the environment and whether we find that impact acceptable. If our environmental standard increases we "loose" minable material and there is a shift from reserves to reserve base or even to resources. This will decrease lifetime predictions. The calculations we did are all based on the consumption rate in 2002. The consumption per person was kept constant, except in the last calculation of energy of fossil fuels. In the other cases the annual consumption grew only due to an increase of population. The assumption of a linear population growth is not a wrong assumption, because the line approaches the curve for the coming 70 years fairly closely. We also used the reserves that were known in 2002 and assumed these did not increase. With the assumptions we made we calculated the oil would run out in 2068, gas in 2057 and coal in 2072. This is incredibly close to the year we live in, so it is a really important problem. Taking into account an increase of consumption of 2% for countries other than the USA, all fossil fuels would be finished in 2074. So unless something is drastically changed in the way we use our resources, humanity will have to face living without oil, gas and coal and all the products and energy derived from them. CONCLUSIONS A few problems rise when predicting population growth however the model used is the best model present and at least gives a good approximation. A few problems do also rise when predicting reserves of materials since there is a big change in predictions from 1970 to 1992 to our predictions; this is mainly due to two factors. One, other mining techniques have become economically available and two, new mining techniques have been developed. Both factors results in a shift from resources to reserve bases and from reserve bases to reserves. This does not mean that predictions are unnecessarily because it reminds us that our reserves are finite. It also tells us something about the time reserves will be depleted. Gold will be depleted to our calculations in 2018 (2034 if you consider reserve bases) which means young generations will very likely witness the day we ran out of gold. Oil, gas and coal will be depleted (to our calculations) in respectively 2068, 2057 coal will not run out for some time yet however when coal will replace the gaps oil and gas leave behind all fossil fuels will be depleted by the year of 2074. This means that our children and definitely our grandchildren will witness the day we ran out of fossil fuels. Certain factors might increase these lifetime predictions a bit. If we increase the accuracy in which we find fossil fuels, costs will drop and reserves will increase. However if our environmental standard would increase costs of mining fossil fuels will increase (because mining has a negative effect on the environment.) and reserves will drop. This implies that lifetime predictions would decrease. The most important conclusion is that we will run out of fossil fuels and other materials and that we will run out within considerable time. Therefore it is of great importance that we do start to look for alternatives for fossil fuels and the other materials we will soon have to do without. References: -Stover, J. and Kirmeyer, S., 1997. DemProj: A computer program for making population projections, The Futures Group International and Research Triangle Institute. -Marshak, S, 2003. Oil formation and trapping. -Meer de, S. System Earth and the Challenge of Sustainable Development. -Wikipedia organization, Petroleum geology. -United Nations, 1983. Manual X: Indirect techniques for demographic estimation, New York, United Nations -U.S. Census Bureau Gerelateerde artikelen:  Voorspellingen reserves ertsen en fossiele brandstoffen
 Nederlandstalige samenvatting.  Wereld reserves fossiele brandstoffen
 Overzicht toereikendheid voorraden aardolie, aardgas en steenkool en geografische spreiding. |